2D-LC Smart Calculator
A lightweight version without the visualization tool can be downloaded at the bottom of this page.
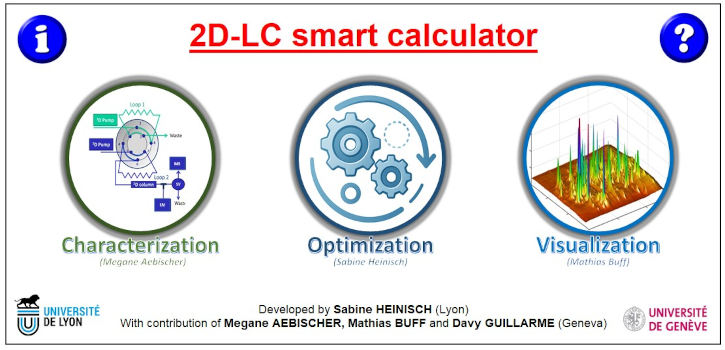
The "2D-LC Smart Calculator" is a tool co-developed by the University of Geneva (Megane Aebischer, Mathias Buff, and Davy Guillarme) and the University of Lyon (Sabine Heinisch). It integrates several embedded macros essential for its operation. In comprehensive LC×LC, there is a strong interplay between the many parameters in both the first and second dimensions, making method optimization complex and requiring advanced modeling tools.
This calculator supports either RPLC or HILIC in the first dimension, and RPLC in the second dimension. It was specifically designed to optimize LC×LC methods for small molecules and peptides. Its main objective is to assist users, including either beginners or more experienced users seeking to fully optimize their analytical conditions and better understand what needs to be done. The software consists of three main modules:
1. Characterization
This module offers a structured protocol for experimentally characterizing your LC×LC system. It accounts for system-specific parameters such as extra-column variances and dwell volumes in both dimensions, as well as system pressure in the second dimension, all of which can strongly affect LC×LC performance. Proper characterization is crucial to ensure accurate and effective method optimization.
2. Optimization
This is the core component of the calculator. Based on the inputs of the user for 1D, 2D, and interfacing conditions, the tool calculates key performance metrics, including:
- Effective peak capacity in each chromatographic dimension and in the 2D setup
- Dilution factor in each chromatographic dimension and in the 2D setup
- Number of runs in the second chromatographic dimension
- Solvent dilution factor between dimensions (which can be performed either with an additional pump or using ASM®)
The calculator also provides optimal conditions to reach the best possible performance using Pareto plot optimization and Derringer function calculations. The optimization methodology embedded in the calculator has been developed for more than a decade by Sabine Heinisch and is fully described in published literature 1 2 3.
3. Visualization
Due to the Excel limitations in 3D representation, the visualization tool was developed in Python, and allows users to visualize results intuitively. By clicking the “Visualization” button in the Excel interface and uploading a compatible Excel file (containing retention times and UV or MS signals), users can generate a variety of 3D representations, including heat maps or 3D surface plots.
In the end, this software suite is intended to help chromatographers by:
- Enabling a better understanding of LC×LC system performance through Characterization
- Supporting method development using a rigorous, sound Optimization approach
- Facilitating intuitive Visualization of complex 3D data
We hope this tool will encourage more users to adopt comprehensive LC×LC, a powerful and underutilized analytical technique for resolving complex mixtures.